The yield curve shows the interest rates of bonds with different maturity.
But let’s take one step back. A bond is a loan made by a lender to a borrower. The bond has a fixed face value that the lender will get back at maturity.
The maturity date is the date when the borrower will pay the face value to the lender. Before maturity, the bond pays an interest rate to the lender. This interest rate is the one the yield curve shows.
Risky rewards
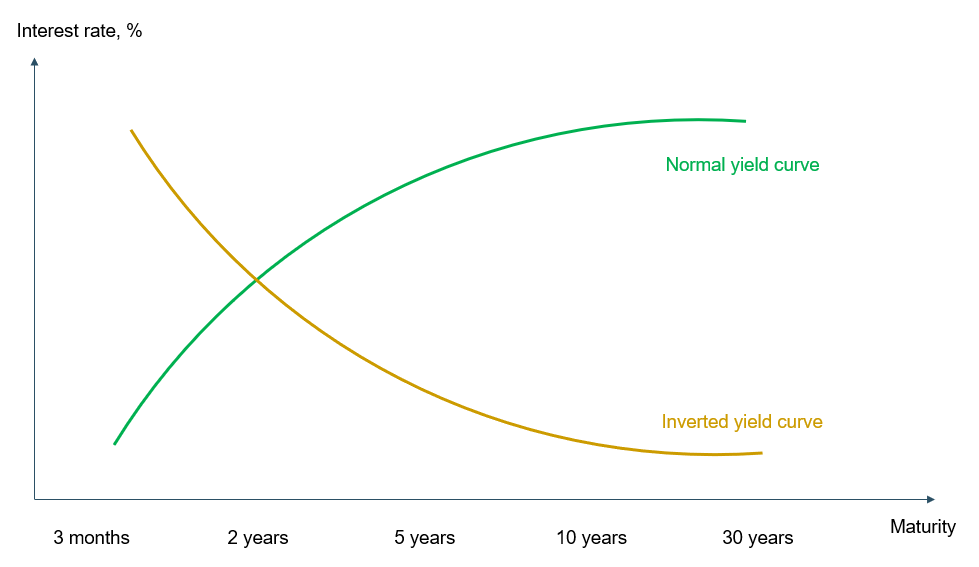
The yield curve usually represents interest rates of US government bonds with different maturities, plotting the interest rates (y-axis) for the different maturities (x-axis): usually three months, two years, five years, ten years and 30 years.
Usually the interest rate is higher the longer the maturity. The intuition is that lending your money for a longer period is more risky, since more things can happen during that period, and so you are rewarded with a higher interest.
Consequently, the normal yield curve is upward-sloping.
Trouble with the curve
A yield curve can also be flat, meaning that a short-term bond and a long-term one pay the same interest, or inverted, meaning that a short-term bond pays a higher interest than a long-term one.
The interest rates on the bonds that form the yield curve are determined by the market and the level of demand for them, so they reflect the expectations on the future level of interest rates.
Consequently, the shape of the yield curve provides indications of where the economy is heading and can be relevant, for example, for house owners paying a mortgage.
Recession roadsign?
A normal yield curve usually indicates economic expansion. When investors expect interest rates to increase, they prefer to buy short-term bonds to later move their funds into bonds yielding higher interest. Increasing the demand for short-term bonds decreases their interest – resulting in an upward sloping yield curve.
An inverted yield curve usually indicates economic recession. When investors expect interest rates to decrease in the future, they prefer to lock their savings in long-term bonds before the yields decrease further. Increasing the demand for long-term bonds decreases their interest compared to short-term bonds – resulting in a downward sloping yield curve.
The yield curve has been inverted in the last year and has now turned to normal again. According to some investors this is an indicator of a recession on the way, following the trend of recent history that recessions follow inverted yield curves.